Certain members of our team LOVE riddles. In their honor, here’s a good one: what’s both old and new, useful and more powerful than a team of heavy-weight contortionists? No, not a 110,000 horsepower engine! This is a tech blog. Want to try again? Give up? The answer is….
PSA Version 5.6!
We bet you didn’t see that one coming!
In all seriousness, we are very excited about the release of version 5.6. This new version of our professional services automation (PSA) software includes a plethora of new automation features that can greatly increase your productivity, your efficiency and your profitability.
Over the next few entries, we will be exploring some of 5.6’s new and interesting additions starting with the new Statistics Board.
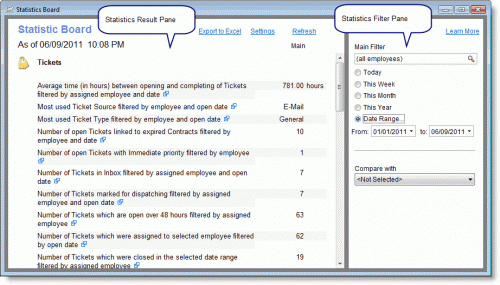
We recognize that maximizing efficiency and profitability requires more than just automation services; it requires information. So, with version 5.6, we have included a new Statistics Board that provides you with instant access to a variety of statistical and summary information regarding your business. Having access to these key performance indicators (KPIs) gives you the ability to evaluate the performance of both your individual employees and your business as a whole.
From providing you with easy access to information, such as the average time it takes to complete a Ticket, to the total Charge hours assessed to your team of technicians, and the total number of newly expired warranty licenses, all of the Statistics Board’s query results enable you to assess your business’ current performance, and help you plan for an even brighter and more successful future for your business.
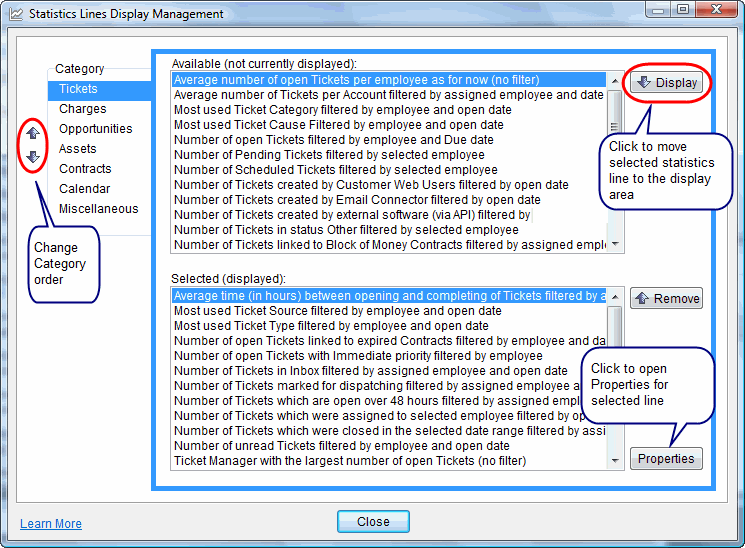
The Statistics Board query results cover a range key performance indicators, including issues pertaining to Tickets, Sales Opportunities, Assets, Contracts and Charges. To help you use the Statistics Board to its full potential, the board can be customized to be filtered by employee and time period. In addition, you can also compare results (e.g. the performance of two technicians during the same time period or the total number of Charge hours for two time periods). Being able to customize your queries and compare results gives you the power to manage your company more efficiently and maximize your time and resources.
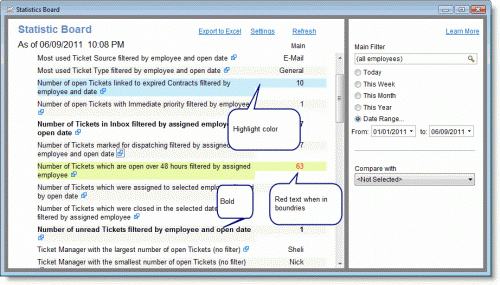
In order to make accessing the query results even easier, you can also personalize the Statistic Board by creating custom names for the Statistic lines, change Text colors (based on the result), background colors and text styles.
Also, for continued analysis, query results can be exported to Excel with a mere click of the “Export to Excel” button. Accessing data to evaluate and bolster your company couldn’t be any easier!
Like the Statistics Board, the list of beneficial features that we have added to version 5.6 will help you run your business more seamlessly and effectively. Most importantly, with this new version, there are new ways for you to reduce the number of hours you spend managing your company while you increase the number of hours you spend growing your company.
We feel fortunate to be sharing all of these exciting updates with you and look forward to sharing more addition insights into version 5.6’s new features with you over the next couple of weeks.
In the meantime, enjoy exploring this new and exciting 5.6 version of our PSA! And for those who have yet to upgrade, click here.
Also, for those not yet using the app already, we invite you to try a fully functional, 30 day free trial of thew new version by clicking here.
We hope you enjoy!
Until next time,
Success Team


